Features
Everything jamovi can do
A familiar spreadsheet, a full suite of analyses, beautiful plots, the power of R, and one-file reproducibility. Free and open, used in over 300 universities.
A spreadsheet, supercharged for stats
Immediately familiar to anyone. Enter or paste data, filter rows, compute new variables, and watch your results recompute the instant anything changes.
SPSS
.sav
SAS
.sas7bdat
Stata
.dta
CSV / text
.csv
Excel
.xlsx
R
.rds
Opens directly. No conversion or export step.
Works with your existing data
jamovi reads your existing data files directly: SPSS, SAS, Stata, CSV, Excel and more. No conversion, no export step, just open and analyse.
From t-tests to mixed models, and beyond
Every essential analysis is built in. Need something more specialised? Add it in a click from the community library.
Exploration
Descriptives, summaries & plots
T-Tests
One-sample, independent & paired
ANOVA
Factorial, repeated measures, ANCOVA
Regression
Correlation, linear & logistic
Frequencies
Proportions & contingency tables
Factor
Reliability, PCA, EFA & CFA
Need more? Add modules.
From mixed models and meta-analysis to Bayesian methods and beyond. Install extra analyses in one click from jamovi's growing community library.
Beautiful, publication-ready plots
Plots are analyses too. Set one up once and it updates live as your data or options change, then drops straight into your write-up as an APA-ready figure. Every one is powered by R's ggplot2.
Click a plot to see an example made in jamovi.
Write your report right in your results
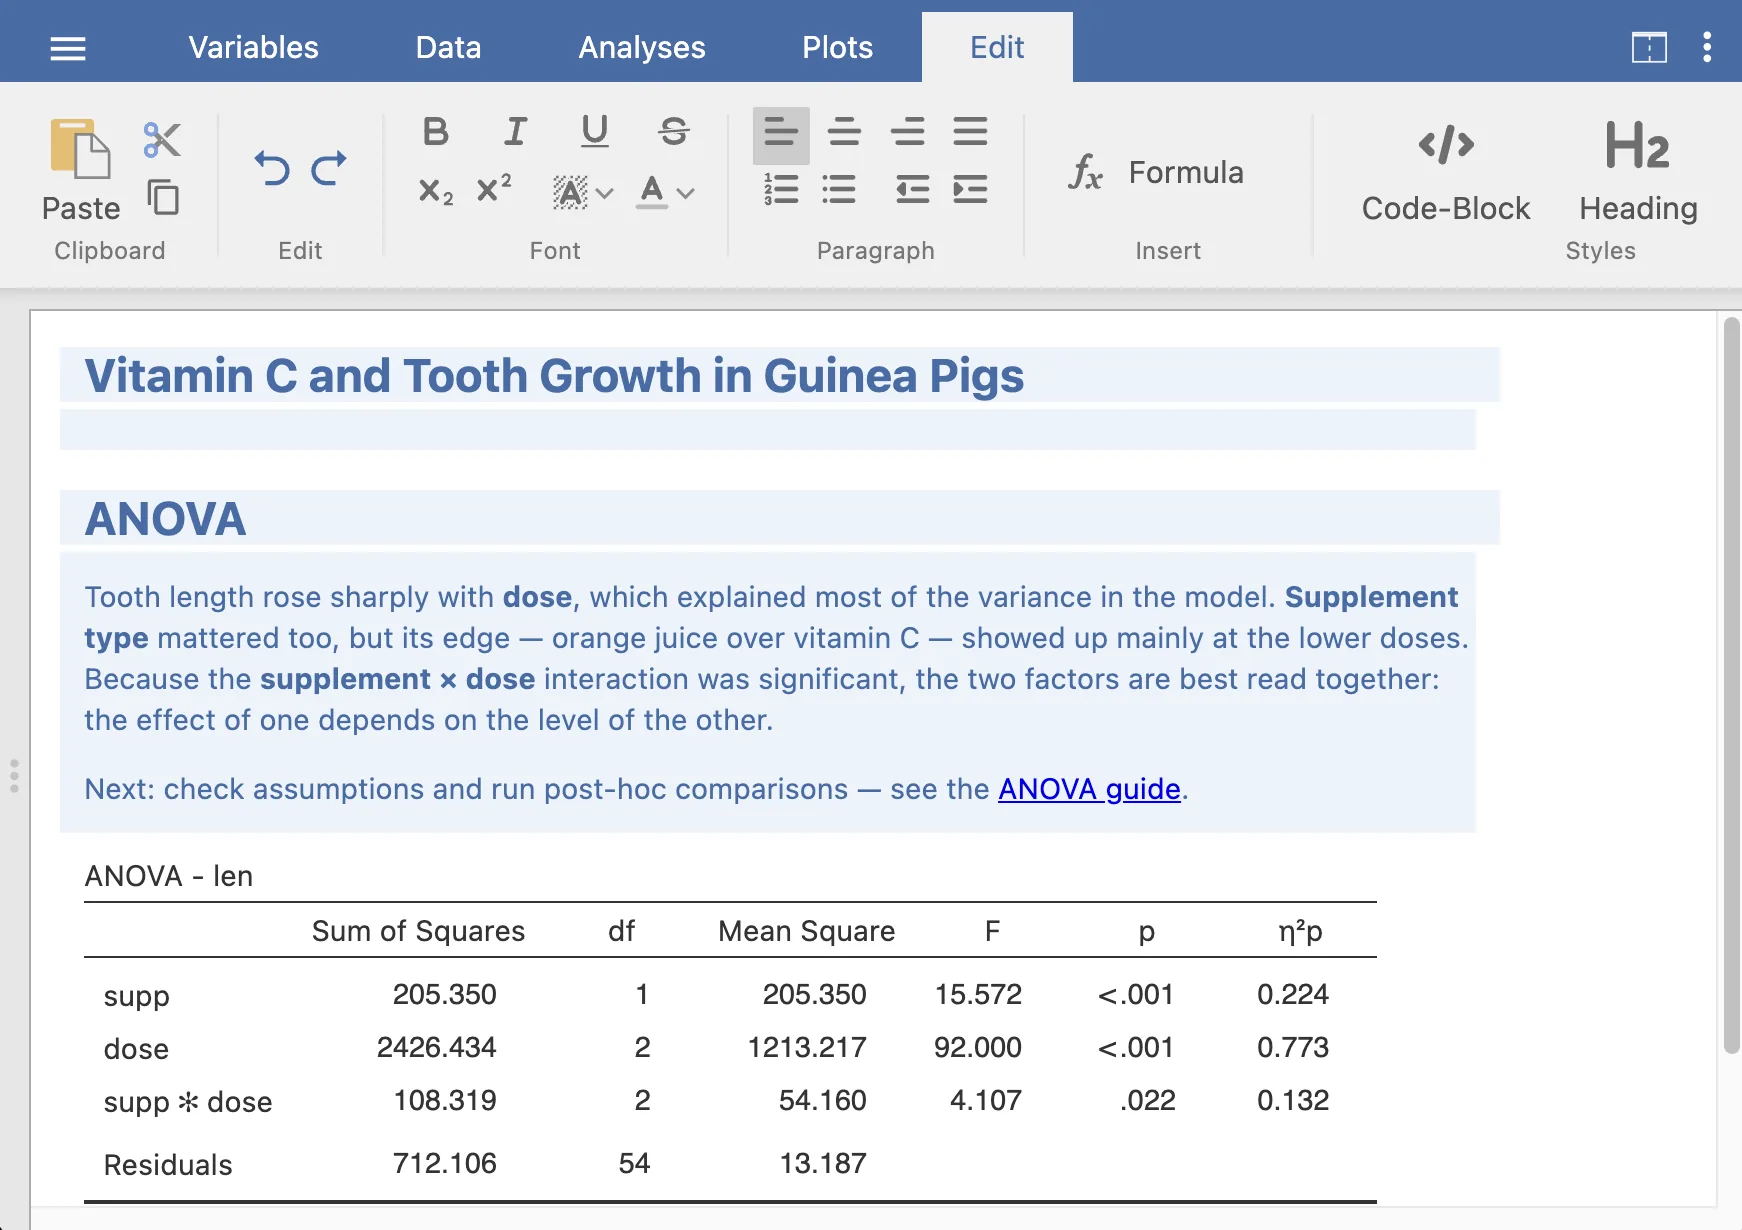
Results in jamovi aren't static output. Switch to Edit mode and annotate them directly, adding headings, notes, formatting, even formulas and links. Share the annotated results with colleagues, students or reviewers, and they can follow your interpretation right alongside the numbers.
Powered by R — see it, write it
jamovi runs on R, and it doesn't hide it. Every analysis shows the exact R code behind it, ready to copy into RStudio. Want to write your own? The Rj Editor runs R right inside jamovi, your data already loaded, no setup.
Reproducible, by default
Reproducibility shouldn't be complicated. jamovi saves your data, your analyses, their options and the results all in one file. Back it up, share it with colleagues, and reopen it any time. It's like you never left.
Study1.omv
data, analyses & results in one place
Extend jamovi, or extend it for everyone
The community library is full of modules that add new analyses in a click. And when the one you need doesn't exist yet, you can build it in R and publish it for the whole community to use, the same way every module here was made.

SummaryTables

MAJOR

Statkat
%20--%3e%3csvg%20version='1.1'%20id='svg13659'%20xmlns:cc='http://creativecommons.org/ns%23'%20xmlns:dc='http://purl.org/dc/elements/1.1/'%20xmlns:rdf='http://www.w3.org/1999/02/22-rdf-syntax-ns%23'%20xmlns='http://www.w3.org/2000/svg'%20xmlns:xlink='http://www.w3.org/1999/xlink'%20x='0px'%20y='0px'%20viewBox='0%200%2074%2044'%20style='enable-background:new%200%200%2074%2044;'%20xml:space='preserve'%3e%3cstyle%20type='text/css'%3e%20.st0{opacity:0.4;fill:%239F9F9F;enable-background:new%20;}%20.st1{fill:none;stroke:%239F9F9F;stroke-width:1.5;}%20.st2{fill:none;stroke:%239F9F9F;stroke-width:1.5;stroke-dasharray:2.0263,2.0263;}%20.st3{fill:none;stroke:%236B9DE8;stroke-width:3;}%20.st4{fill:%23FFFFFF;stroke:%236B9DE8;stroke-width:3;}%20.st5{fill:%236B9DE8;stroke:%236B9DE8;stroke-width:2;}%20.st6{fill:%23FFFFFF;stroke:%23E6AC40;stroke-width:3;}%20.st7{fill:%23FFFFFF;stroke:%23E6AC40;stroke-width:2;}%20%3c/style%3e%3cg%3e%3crect%20x='20.3'%20y='0'%20class='st0'%20width='36.1'%20height='44'/%3e%3cg%3e%3cg%3e%3cline%20class='st1'%20x1='38.4'%20y1='0'%20x2='38.4'%20y2='1.1'/%3e%3cline%20class='st2'%20x1='38.4'%20y1='3.3'%20x2='38.4'%20y2='41.8'/%3e%3cline%20class='st1'%20x1='38.4'%20y1='42.9'%20x2='38.4'%20y2='44'/%3e%3c/g%3e%3c/g%3e%3c/g%3e%3cg%3e%3cpath%20id='path13075'%20class='st3'%20d='M34.8,12.1H5.8'/%3e%3ccircle%20id='circle13081'%20class='st4'%20cx='20.4'%20cy='12.2'%20r='5'/%3e%3crect%20id='rect13085'%20x='34.3'%20y='8.2'%20class='st5'%20width='1.1'%20height='7.9'/%3e%3crect%20id='rect13085_2_'%20x='5.2'%20y='8.1'%20class='st5'%20width='1.1'%20height='7.9'/%3e%3c/g%3e%3cg%3e%3cpath%20id='path13075_2_'%20class='st6'%20d='M52.9,32.2H23.8'/%3e%3ccircle%20id='circle13081_2_'%20class='st6'%20cx='38.5'%20cy='32.3'%20r='5'/%3e%3crect%20id='rect13085_4_'%20x='52.4'%20y='28.3'%20class='st7'%20width='1.1'%20height='7.9'/%3e%3crect%20id='rect13085_3_'%20x='23.3'%20y='28.3'%20class='st7'%20width='1.1'%20height='7.9'/%3e%3c/g%3e%3c/svg%3e)
TOSTER

FoodieStats

esci

behaviorchange
your module
Built by the community, and anyone can add to it.
300+
universities teach statistics with jamovi
Intuitive enough for a first stats class, yet powerful enough for real research, and free for every student to run at home. The community has built free teaching resources too: textbooks, video tutorials and more, many gathered on the community page.
Free and open, forever
jamovi is free for everyone to use and open source for anyone to inspect, fork or improve. No fees, no catch.
Ready to try jamovi?
Start analyzing your data today with our free, easy-to-use, and collaborative statistical spreadsheet.